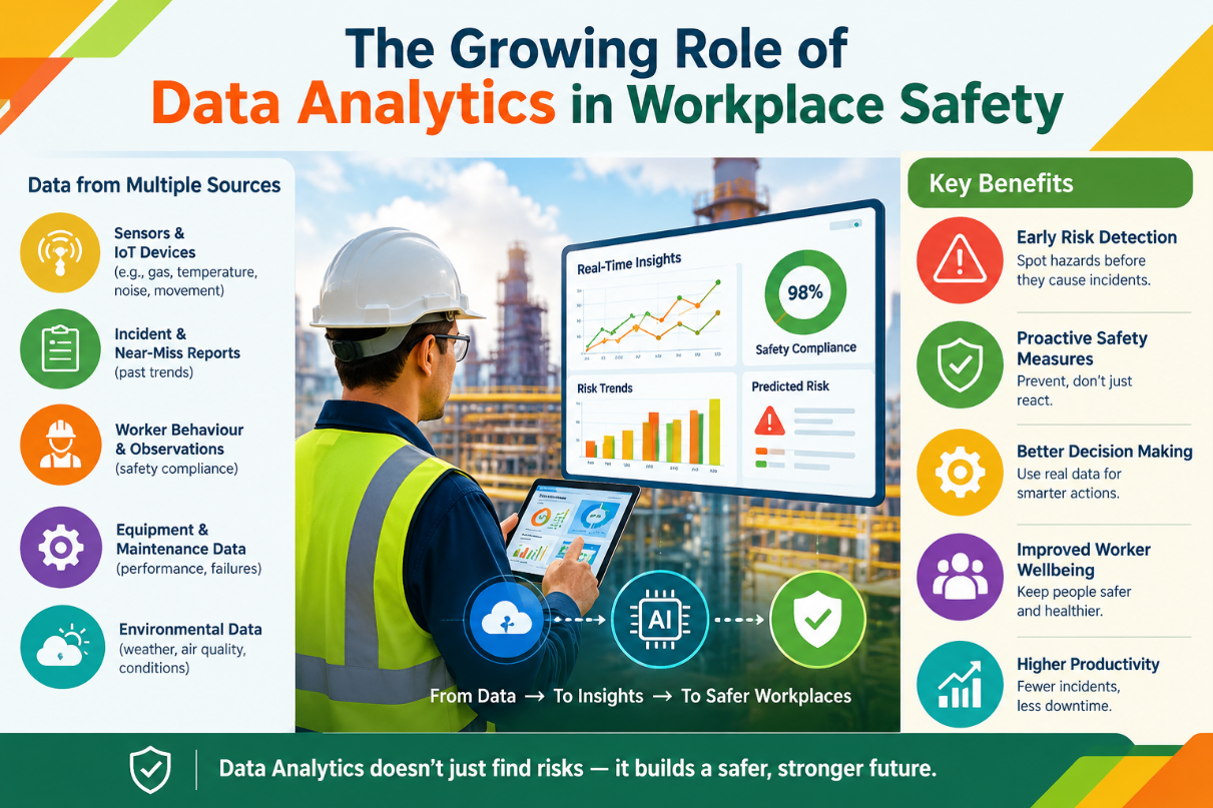
The growing role of data analytics in workplace safety is not simply about adding sensors or dashboards. It is about building a dependable cycle, collect useful information, identify a risk, involve the people affected, take practical action and check whether the action worked. Used that way, analytics can help organizations move from counting harm to preventing it.
Workplace safety is shifting from reacting to accidents toward spotting risks early and acting before someone gets hurt. Data analytics helps organizations connect information from incidents, near misses, inspections, maintenance, training and equipment sensors so EHS teams can see patterns and make better-informed decisions.
From Incident Records to Early Warnings
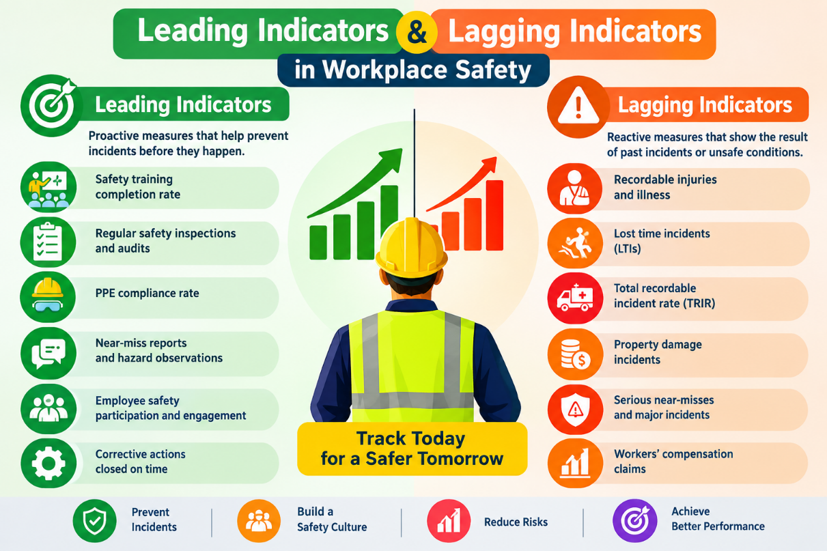
Traditional safety reports often focus on what has already happened: injuries, lost-time cases or equipment damage. These lagging indicators show the outcome after prevention has failed. Leading indicators, by contrast, track whether preventive activities are working. OSHA recommends using leading indicators to drive improvement and lagging indicators to assess performance.
When these measures are reviewed together, a small signal can prompt an earlier intervention. A rise in near-miss reports around a loading bay, for example, might lead a team to review vehicle routes, visibility, pedestrian segregation and shift handovers before a serious collision occurs.
Analytics Help
Spot recurring hazards: Compare incident, near-miss and inspection data by work area, task, shift, equipment or contractor to identify patterns.
Strengthen maintenance planning: Combine equipment condition data with maintenance history to flag abnormal performance and schedule inspection or repair before a defect creates a safety risk.
Improve exposure controls: Sensor data can help identify changes in environmental conditions, such as temperature or humidity, and support timely checks of controls and work practices.
Target training and procedures: Review recurring errors, audit findings and worker feedback to identify where task-specific training, clearer procedures or better-designed work could reduce risk.
Learn from incidents: Bring together digital work records, inspection results and equipment information to investigate contributing factors.
The value is not in collecting the largest possible volume of data. It is in turning relevant, reliable information into a clear decision: what needs attention, who will act and how the organization will verify the risk is controlled.
Make The Data Useful and Trustworthy
Start with a specific safety question rather than a technology purchase. Select a small set of measures linked to a meaningful hazard.
Define how each will be recorded, and assign someone to review the results and coordinate action.
OSHA advises that effective leading indicators should be specific, measurable, accountable, reasonable and timely; it also recommends communicating progress with workers and reassessing indicators as the program develops.
Key practices to keep in mind:
Check data quality: Agree on consistent definitions for incidents, near misses, hazards and corrective-action closure.
Use context, not rankings: A department with more reports may have stronger reporting engagement, not necessarily worse safety. Review the underlying conditions before drawing conclusions.
Protect worker trust: Explain what information is collected, why it is needed, who can access it and how it will be used. In its guidance on digitalization, the ILO warns that poorly managed monitoring can intensify surveillance, reduce worker autonomy and affect well-being.
Keep people involved: Ask workers and supervisors to interpret findings, challenge assumptions and help select controls.
Verify the outcome: Track whether corrective actions were completed and whether exposure or risk changed, not just whether a dashboard turned green.
Analytics Supports Judgment
Predictive models and real-time alerts can help EHS teams prioritize attention, but they are not proof that an incident will happen or that a workplace is safe when an alert is absent. Poor-quality or incomplete data can produce misleading patterns, and a model may overlook local conditions that workers understand from experience.
The ILO’s position: digital monitoring and predictive analytics should sit within a robust occupational safety and health framework, with human judgment, ethical standards and worker rights at the centre.
Build a safety analytics dashboard spec: KPIs, leading indicators, and real-time alert rules to predict workplace incidents before they occur
Transform workplace safety data into an OSHA-aligned audit checklist that tracks leading indicators, near misses, and equipment compliance metrics
Key Components of Safety Data Analytics
Data Collection: Gathers inputs from HSE Data Analytics including incident reports, near misses, audits, training records, and environmental monitoring.
Real-Time IoT Monitoring: Uses smart devices and sensors via Connected Worker Platforms to track air quality, temperature, noise, and PPE compliance.
Predictive & Prescriptive Insights: Applies machine learning to historical data to forecast equipment failures, identify behavioural patterns, and recommend corrective actions before accidents occur.
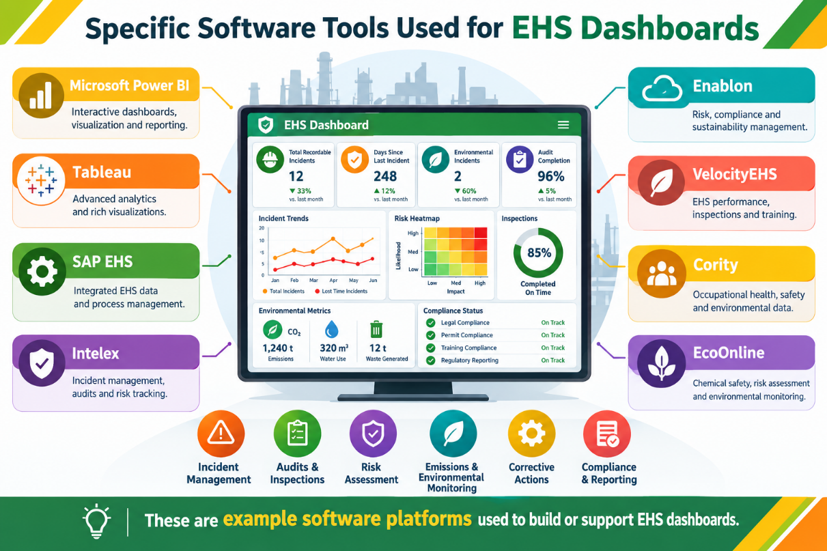
Specific software tools used for EHS dashboards
Effective EHS dashboards track a balanced mix of lagging indicators that already happened and leading indicators that predicts future risk. Core safety KPIs (lagging indicators)
Leading EHS platforms with built-in dashboards
Velocity EHS -offers real-time KPIs, customizable widgets, AI-driven predictive insights, and mobile-friendly views, making it well suited for multi-site industrial firms that need incident-to-CAPA workflows with strong analytics.
Intelex, by Intelex Technologies – provides dynamic risk registers, deep business intelligence integrations, and enterprise-grade reporting, ideal for global manufacturers requiring centralized incident management and compliance tracking.
Cority EHS– delivers unified EHSQ “Clouds” with dashboards covering safety, health, quality, and medical surveillance, serving organizations that want an integrated EHSQ ecosystem with ESG reporting.
Enablon from Wolters Kluwer– features real-time analytics for safety and risk data along with robust regulatory reporting, commonly used in high-hazard industries such as oil and gas, mining, and chemicals.
EHS Insight– includes an interactive KPI dashboard with an AI-powered “Field Suggestion Copilot” and views for corrective action aging, targeting compliance-focused teams that want automated insights and due-date management.
SafetyCulture, formerly iAuditor- emphasizes mobile-first inspection analytics and real-time dashboards for field data, best for teams whose primary EHS data comes from inspections, audits, and hazard reports. Higher Elevation Software’s EHS-Dashboard – provides role-based views at the site, division, and enterprise levels, supports unlimited users per site, and enables fast implementation, appealing to mid-market and enterprise EHS directors who want environmental, health, safety, quality, and ESG metrics in one system.
IFS Ultimo – offers analytics and dashboards for monitoring safety performance, integrated with asset management, useful for organizations linking EHS metrics to maintenance and asset reliability.
EcoOnline -provides real-time dashboards for safety and compliance with a focus on chemical management, serving chemical and process industries that need SDS and exposure tracking with visual KPIs.
HSI Donesafe – includes real-time dashboards and automated reporting tools, suited for firms wanting streamlined incident reporting with visual performance tracking.
“These measure outcomes after incidents occur and are essential for regulatory reporting and benchmarking”
Leading Indicators (Predictive and Preventive)
- The Near-Miss Reporting Rate
- The Near-Miss Ratio
- The Inspection Completion Rate
- The Training Completion or Currency Rate
- The Corrective Action Closure Rate
- The Average Days to Close Corrective Actions
- The Safety Observation Rate
- Preventive Maintenance Compliance
- The JHA or High-Risk Task Coverage metric
- The Permit Compliance Rate
Core Safety Kpis (Lagging Indicators)
- The Total Recordable Incident Rate, or TRIR
- The DART rate
- The Lost Time Injury Frequency Rate, or LTIFR
- The Severity Rate
- The Serious Injury and Fatality rate, or SIF rate
- The First Aid Case Rate.
- The Experience Modification Rate, or EMR
Environmental and Health Kpis
For environmental performance, useful KPIs include the number of spills or releases categorized by type such as oil, chemical, or solvent; monthly waste generation in kilograms; the count of effluent exceedances; deviations in air emissions; and tracking of permit expirations with a target of zero lapses.
For occupational health, relevant metrics include the medical case rate; sick days attributable to work-related illness; the percentage of exposure monitoring samples within permissible limits; the completion rate for health surveillance programs; and the coverage rate for ergonomic assessments.
Dashboard Design
Normalize by exposure: Always express injury rates per 200,000 hours (or per 100 employees) to compare sites fairly.
Set targets: E.g., TRIR below industry average, inspection completion ≥ 95%, corrective action closure ≥ 90% within 30 days.
Segment views: Corporate dashboard (aggregate TRIR, SIF, EMR) vs. site dashboard (near-miss trends, inspection gaps, PM compliance).
Highlight trends: Show 3–6 month rolling averages, not just monthly snapshots, to spot directional changes.
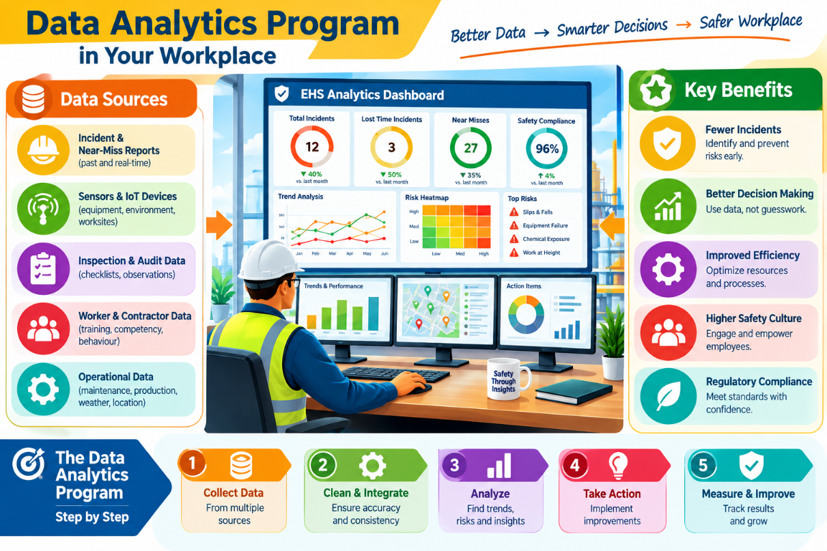
Steps to Implement a Data Analytics Program in Your Workplace
1. Define objectives and business case
2. Assess current state and data maturity
3. Design target operating model and governance
4. Build data infrastructure and integration
5. Develop analytics capabilities and tools
6. Pilot, iterate, and scale
7. Embed analytics into daily operations and culture
8. Monitor, evaluate, and continuously improve
How to Assess Our Current Data Maturity and Gaps
Assessing your current data maturity and gaps is a structured process that combines self-scoring against a maturity model, data quality audits, and stakeholder interviews. Below is a practical, step-by-step approach you can run internally over 2–4 weeks.
Step 1: Define scope and objectives
Step 2: Choose a maturity framework
Step 3: Conduct data quality assessment (DQA)
Step 4: Interview stakeholders
Step 5: Map gaps and prioritize
Step 6: Build a roadmap
Quick Self-Assessment Checklist
Answer these with Yes/No/Partial to get a rapid maturity snapshot:
Strategy: Is there a written data strategy for EHS linked to safety goals?
Governance: Is someone formally accountable for EHS data quality?
Quality: Do you routinely check incident data for completeness and accuracy?
Architecture: Can you easily join incident data with training or maintenance records?
Analytics: Do site managers use dashboards in weekly safety meetings?
Literacy: Have supervisors received training on interpreting EHS metrics?
Establish data governance policies for EHS data
Choose the right tools for a manufacturing plant
Build a business case for executive sponsorship
Summary
Data analytics shifts workplace safety from reactive injury reporting to proactive hazard prevention and predictive risk management.
Active Hazard Reduction stops minor anomalies from turning into serious injuries. Targeted Interventions pinpoints high-risk departments or tasks to use safety resources effectively. Higher Engagement builds a transparent culture where workers actively report and mitigate risks.
Join Ken Institute,
unlock a world of online courses in MBA in HSE, Occupational Health and Safety, Fire Safety, Mechanical Engineering, and Environment and Sustainability.
Internationally recognized courses and training programs designed to empower individuals and organizations.
Join Ken Institute now to advance your career with Higher Certification in Occupational Health & Safety
Connect now and take the next step toward professional excellence!
+91 7569034271
Let’s connect together on: Facebook, YouTube, LinkedIn, and Instagram.